Dorwin Liang
Data Analytics & Governance Specialist
I enable Complex Data to be analyzed for insights
I enable Complex Data to be analyzed for insights
Years of Data Analytics Experience
Analytics Certified
In this project, I set out to understand how the New York Police Department (NYPD) can make more informed budgeting and resource allocation decisions based on crime trends using NYPD arrests dataset. By analyzing NYPD arrests from 2006 to 2023, I identified key patterns in arrests, crime types, and demographic factors. Using Python for data cleaning and Tableau for visualization, I discovered many insights such as higher arrest rates on specific weekdays, the prevalence of drug-related crimes, and the significant involvement of the different age groups in criminal activities. These findings can help the NYPD strategically optimize resources to enhance public safety and efficiency.
Tools Used
This analysis explores dog bite cases in NYC from 2015 to 2022, driven by my concerns as a pet owner about the prevalence of unleashed dogs in parks. Using data from the NYC Department of Health and Mental Hygiene, I wanted to uncover trends and generate insights to help prevent these incidents. Through data cleaning in Excel and visualization in Tableau, I identified interesting key patterns that may not be so obvious at first. The insights generated can guide NYC authorities in implementing targeted awareness and safety measures, particularly focusing on high-risk breeds and areas.
Tools Used
The purpose of this project is to identify health variables that can predict heart disease in patients. I analyzed the UCI Heart Disease Dataset to identify key health variables linked to heart disease using machine learning models including logistic regression, KNN, and Naive Bayes models in R. Through this analysis, I went through the entire data analytics life cycle from data cleaning to generating insights for health professionals to aid in preventing potential heart diseases in high risk individuals.
Tools Used
Payton F.
Over the time I worked with Dorwin, he was able to do anything asked of him (in this internship, he focused on reworking our website to be more user-friendly and competitive in the market). I had the pleasure of supervising Dorwin during a summer internship. What really impressed me the most about Dorwin is his ability to work independently and effectively: He researched, evaluated, and implemented new initiatives without any problems. When he had questions, he asked. When we had ideas, he mocked them up and shared them. I never quested if he was working or doing the job to the best of his ability because he always delivered more than asked of him. Perhaps the best thing about Dorwin is that he is very easy to work with; as serious as his work is, Dorwin is easy-going and a great person to collaborate with. Without hesitation, I recommend Dorwin for your team, whether it be to design your website or otherwise.
Mimi T.
I worked with Dorwin Liang for 6 weeks while he interned for Platinum Edge Tutoring. In that time I watched him create valuable edits and updates to help PET’s website. Dorwin grew so much in his short time at the company in his professional development and I am honored to have been involved in his growth. Not only did Dorwin make positive changes to the company’s site, he also helped us to understand the changes and what positive impacts the changes will have on our website's traffic. Dorwin took constructive criticism very well and implemented any and all changes we asked of him. The changes he made to our site has positively impacted site traffic! I am excited to see his continued professional growth and I am optimistic of his career trajectory.

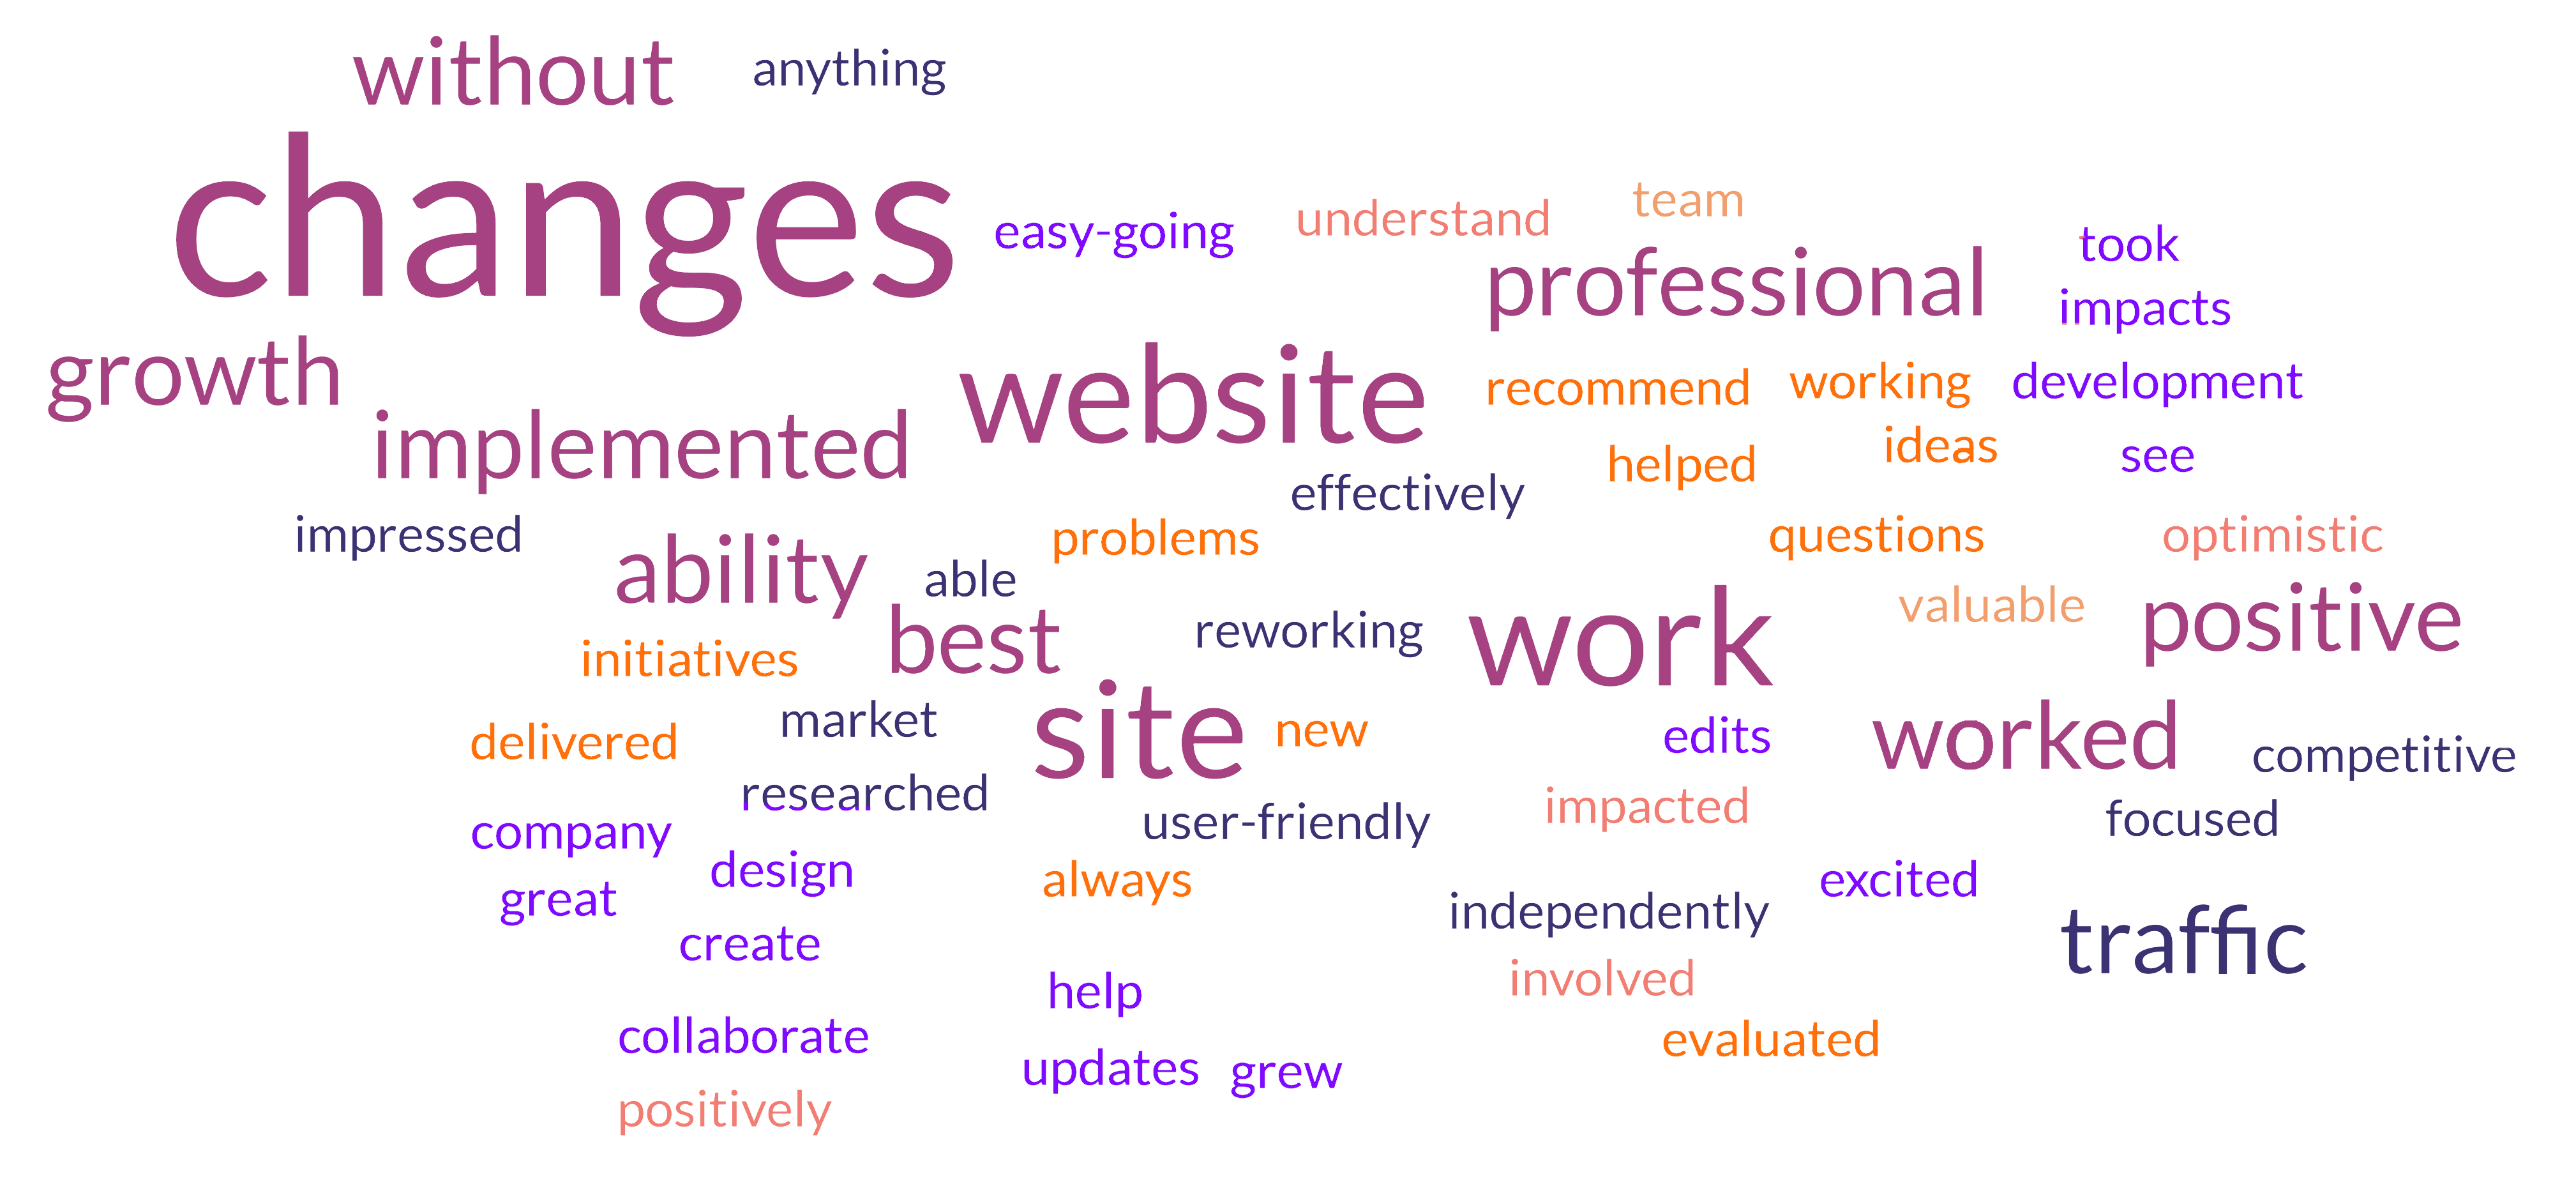
Word Bubble of most common words used in my recommendations from managers